City Economic Zone Planning Scale Model
Introduction
Economic zones are engines of urban growth.
Industrial parks, tech corridors, free trade zones.
But how do you sell a vision that spans decades and billions of dollars?
Spreadsheets and maps are not enough.
You need a physical model.
Specifically, a City Economic Zone Planning Scale Model.
This guide explains why economic zones need custom models.
What features matter.
And how to use them to attract capital and coordinate development.
Let us begin.
What Is a City Economic Zone Planning Scale Model?
It is a physical miniature of a designated economic development area.
Built on a sand‑textured base.
A City Economic Zone Planning Scale Model shows land parcels, infrastructure, utilities, logistics networks, and phasing.
Unlike a general city model, this one emphasizes economic functions:
Factory sites, logistics hubs, office parks, housing for workers, power substations, and export processing zones.
The model is used by economic development agencies, government authorities, and private developers.
Why Economic Zones Need Physical Models
Economic zones are marketed to global investors.
A physical model builds trust.
A City Economic Zone Planning Scale Model allows investors to see:
Where their factory will sit.
How close it is to the port.
Where workers will live.
It also coordinates internal agencies.
Power, water, telecom, and transport planners gather around the same miniature.
For government approvals, a model accelerates bureaucratic decisions.
For public outreach, it explains complex projects simply.
Key Features of an Economic Zone Planning Model
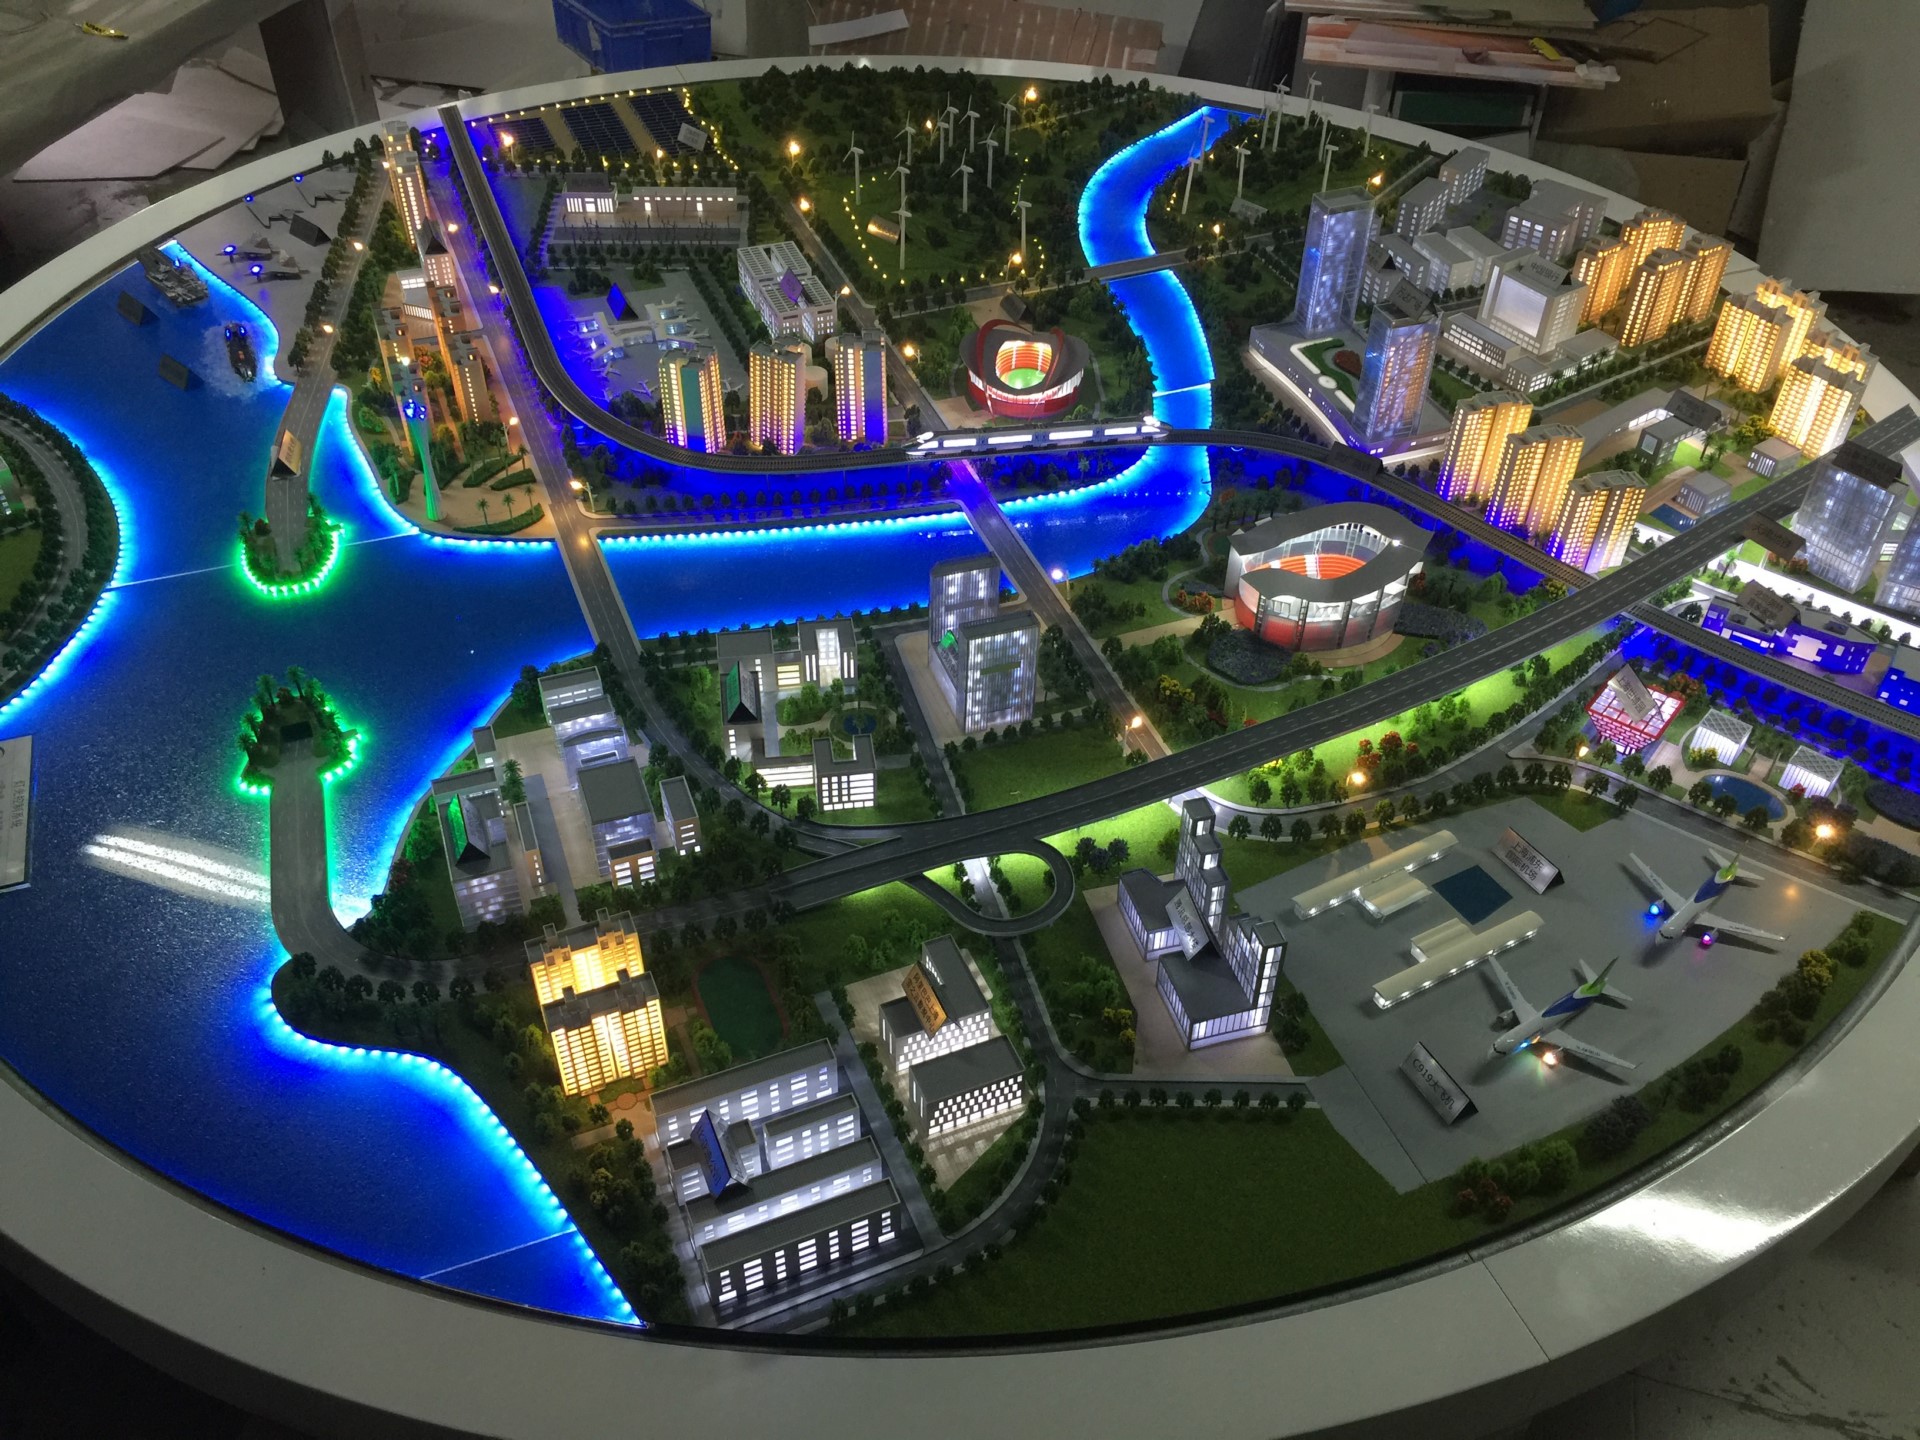
Let us break down what makes a model effective for economic zones.
Parcel and Lot Identification
Each developable plot is numbered.
The legend shows lot size, zoning, and availability status.
LEDs can highlight available parcels.
Infrastructure and Utilities
Power lines, substations, water mains, sewer lines, gas pipelines, fiber optic routes.
Color‑coded lines or symbols.
Logistics and Transport
Ports, rail spurs, highways, truck routes, warehousing zones.
Clear connections to regional networks.
Phasing and Land Release
Phase 1, 2, 3 distinguished by color or texture.
Shows investors when land becomes available.
Support Facilities
Worker housing, schools, clinics, retail, fire stations, security checkpoints.
Essential for integrated economic zones.
Topography and Environmental Constraints
Flood zones, wetlands, steep slopes.
Shows developable vs. constrained land.
Interactive Investment Tools
Removable parcel overlays.
QR codes on each plot linking to investment prospectus.
A well‑designed City Economic Zone Planning Scale Model is a sales and coordination tool rolled into one.
Materials for Economic Zone Models
Economic zone models balance clarity, durability, and presentation quality.
Laser‑cut MDF or acrylic – For building massing and parcel boundaries.
Colored acrylic sheets – For zoning and phasing.
Printed vinyl stickers – For lot numbers and infrastructure symbols.
Fine sand or textured paint – For ground.
Magnetic base – For interchangeable parcel overlays (available/sold).
LED strips – To highlight key infrastructure corridors.
QR code plates – Small acrylic tags linking to digital data.
Avoid detailed architectural landscaping – focus on parcels and infrastructure.
The Custom Production Process: Step by Step
How is an economic zone planning model made?
Here is the typical workflow.
Step 1: Zone Master Plan Review
You provide land use maps, infrastructure plans, and phasing schedules.
The model maker simplifies for the chosen scale.
Step 2: Scale Selection
Common scales: 1:2,000 for a detailed industrial park, 1:5,000 for a large economic zone.
Table size typically 1.5m x 2m to 2.5m x 3m.
Step 3: Base and Terrain
A reinforced MDF or aluminum base is cut.
Topography sculpted if needed (rivers, coastal areas).
Step 4: Parcel and Infrastructure Layout
Lot boundaries, roads, utility corridors are marked.
Parcel numbers are applied as vinyl stickers.
Step 5: Zoning and Phasing Colors
Different colors for industrial, logistics, commercial, residential, open space.
Phase 1, 2, 3 distinguished by color intensity or patterns.
Step 6: Utility and Transport Lines
Water, power, and sewer lines added as colored lines.
Port, rail, and highway connections shown.
Step 7: Support Facilities
Worker housing, schools, clinics shown as simple blocks.
Security checkpoints and fire stations added.
Step 8: Interactivity and Labels
QR codes on each parcel (or a corresponding legend).
LEDs for highlighting key infrastructure.
Step 9: Quality Control and Cover
The model is inspected for legibility.
A clear acrylic cover or low railing is added.
A custom City Economic Zone Planning Scale Model typically takes 8 to 14 weeks.
Applications for Economic Zone Models
Where are these models used?
Investment Promotion and Roadshows
Attract foreign direct investment.
Investors point at available parcels.
Government Approvals and Zoning
Planning commissions approve land use quickly.
Infrastructure Coordination
Power, water, and transport agencies align their plans.
Developer and Site Selection
Companies choose locations based on visible advantages.
Public Outreach
Explain the economic benefits to local communities.
Case Study: Economic Zone Model Attracts $500M in FDI
An Asian country established a new special economic zone.
After two years, investment was slow.
The economic development authority commissioned a City Economic Zone Planning Scale Modelat 1:2,500 scale, covering a 3m x 2m table.
The model showed 200 individual parcels, color‑coded by industry type.
LEDs highlighted available plots.
Each parcel had a QR code linking to detailed investor information.
At a global investment summit, the model was the centerpiece.
Within six months, $500 million in foreign direct investment was committed.
The model cost $35,000.
The return was 14,000 times.
Cost Factors for Economic Zone Models
Area covered – 500 hectares vs. 5,000 hectares.
Scale – 1:2,000 (more detail) costs more than 1:5,000.
Number of parcels – 50 vs. 500.
Infrastructure detail – Basic roads vs. full utilities (power, water, fiber).
Interactivity – Static vs. QR codes and LEDs.
Typical range: 70,000 for a large, highly detailed economic zone with full utility mapping and interactive features.
How to Choose a Model Maker for Economic Zones
Experience with economic zone or industrial park models – Not just residential planning.
Understanding of parcel identification systems – Lot numbers and availability status.
Ability to show utility corridors – Power, water, fiber optics.
References from economic development agencies – Call two.
Ask for a sample of how they represent a utility corridor (e.g., colored lines with legends).
Maintaining and Updating Your Economic Zone Model
Economic zones evolve as parcels are sold and infrastructure expands.
Use magnetic parcel overlays – Switch “available” to “sold” colors.
Replaceable QR code plates – Update links as investment materials change.
Annual review – Compare to current occupancy and infrastructure status.
Budget for updates – Every 2–3 years for major changes.
For cost‑effective updates, a Modular Architectural Sand Table Model approach is ideal – request modular terrain tiles and removable parcel blocks.
Display Tips for Maximum Investment Impact
In a Dedicated Investment Promotion Center
Low pedestal with controlled spotlighting.
Touch screen legend for parcel details.
At International Trade Shows
Portable version on a wheeled cart.
Battery‑powered LEDs and QR code placards.
For High‑Net‑Worth Investor Visits
Private viewing room.
Handheld magnifiers and an investment officer to answer questions.
Common Mistakes to Avoid
Do not make parcel numbers too small.
Investors need to read lot IDs from standing height.
Do not forget utility lines.
Power and water availability are top investor concerns.
Do not use the same color for different phases.
Phasing must be visually distinct.
Do not ignore support facilities.
Worker housing and schools make the zone viable.
Do not skip the legend.
Without a legend, colors and symbols are meaningless.
Integrating with Other Planning Model Types
An economic zone model often complements other planning tools.
An Urban Road Network Planning Sand Table Model focuses on transportation – your zone model shows the roads, but the dedicated road model adds traffic flow and intersection detail.
A City Planning Scale Model for overall municipal planning may include the economic zone as one district – your model is the detailed version for zone‑specific promotion.
During construction, an Urban Construction Sand Table Model takes over, showing phasing of roads, utilities, and building sites.
For city‑wide density and land use, a City Layout Planning Architectural Scale Model provides context – how the economic zone connects to residential and commercial areas.
For greenfield development, a New District Urban Planning Sand Model is similar but more focused on mixed‑use communities. Your economic zone model is tailored to industrial and logistics functions.
Each type serves a different stage. The economic zone model is the specialized tool for investment attraction.
Future Trends in Economic Zone Sand Table Models
Live investment status – LEDs change color when a parcel is sold.
Augmented reality – Scan the model to see projected job creation or tax revenue.
Blockchain‑linked parcels – QR codes lead to immutable land records.
Environmental simulations – Show flood risk or solar potential for each plot.
Yet the core remains.
Investors need to see the land to commit capital.
A physical model does that best.
Conclusion
A City Economic Zone Planning Scale Model is the most powerful tool for attracting investment and coordinating development.
It turns a master plan into a tangible opportunity.
Focus on parcel clarity, utility visibility, and phasing.
Add QR codes or LEDs for interactivity.
Plan for updates as parcels are sold.
Whether you are an economic development authority, zone developer, or government agency, invest in a custom model.
Your investors will see the future.
Your zone will grow faster.
And remember – whether you need an Urban Road Network Planning Sand Table Model for traffic detail, a City Planning Scale Model for municipal context, an Urban Construction Sand Table Model for phasing management, a City Layout Planning Architectural Scale Model for land use density, or a New District Urban Planning Sand Model for mixed‑use communities, each has its role. But for pure economic zone promotion, nothing beats a dedicated city economic zone planning scale model.
Model your zone. Attract the world.


