Ecological City Planning Sand Table Model
Introduction
Cities and nature are often seen as opposites.
But they can coexist – even thrive together.
How do you design a city that absorbs stormwater, hosts wildlife, and cools itself naturally?
Digital maps miss the ecological flows.
You need a physical model.
Specifically, an Ecological City Planning Sand Table Model.
This guide explains why ecological models matter.
What features to include.
And how to use them for truly sustainable urban development.
Let us begin.
What Is an Ecological City Planning Sand Table Model?
It is a physical miniature of a city designed with nature first.
Built on a sand‑textured base.
An Ecological City Planning Sand Table Model shows green infrastructure, habitat networks, water systems, and low‑carbon mobility.
Unlike a conventional city model, this one emphasizes living systems.
Wetlands filter water.
Green roofs reduce heat.
Wildlife corridors connect parks.
The model is used by environmental planners, landscape architects, and green developers.
Why Ecological Planning Needs a Physical Model
Ecological systems are complex and interconnected.
A road cut can fragment a wildlife corridor.
A parking lot can overwhelm a stream.
An Ecological City Planning Sand Table Model reveals these connections.
Planners see where green roofs cluster.
They trace stormwater flow through bioswales.
They identify gaps in the habitat network.
Also, the model builds public support.
Residents point at proposed greenways.
They understand how a new park protects a creek.
For grant applications, a physical model shows environmental impact visually.
Key Features of an Ecological City Sand Table Model
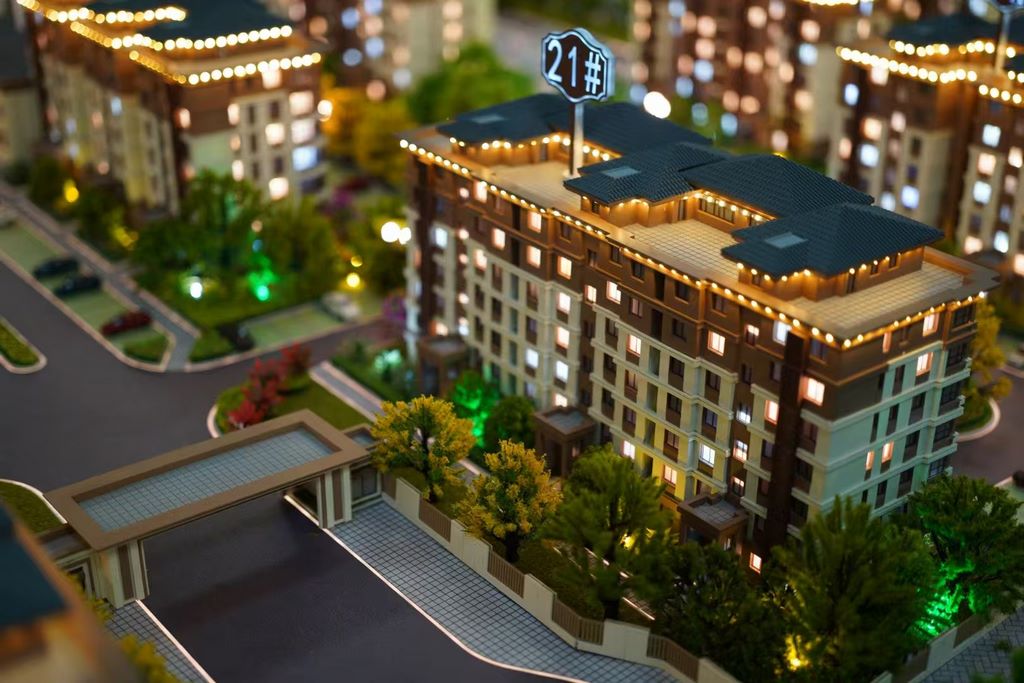
Let us break down what makes a model effective for ecological planning.
Green Infrastructure Network
Green roofs, rain gardens, bioswales, permeable pavement, urban forests.
Distinct colors and textures for each.
Water Systems and Stormwater Management
Wetlands, retention ponds, streams, floodplains, constructed wetlands.
Blue resin or translucent overlays.
Wildlife Habitats and Corridors
Protected areas, migration corridors, habitat patches, pollinator zones.
Connected with green lines or ribbons.
Low‑Carbon Mobility
Bike highways, pedestrian‑only zones, electric transit lines, car‑free districts.
Clearly distinguished from car roads.
Urban Agriculture and Food Systems
Community gardens, rooftop farms, farmers market locations, composting hubs.
Represented with green textures.
Energy and Resource Loops
District heating/cooling networks, waste‑to‑energy plants, water recycling facilities.
Shown with circular symbols.
Climate Adaptation Features
Floodable parks, cooling centers, shaded corridors, heat refuge zones.
Often shown with temperature‑color overlays.
Interactive Scenario Testing
Removable overlays for different ecological strategies.
LEDs showing water flow or habitat connectivity.
A well‑designed Ecological City Planning Sand Table Model answers: “Does this city function like an ecosystem?”
Materials for Ecological City Models
Ecological models use natural and sustainable materials where possible.
Laser‑cut MDF or acrylic – For building massing blocks.
Recycled or bio‑based plastics – For 3D printed elements.
Fine sand and natural‑toned paint – For ground.
Green flocking (hemp or jute) – For green roofs and parks.
Blue resin – For water features.
Translucent green overlays – For habitat corridors.
Printed vinyl – For symbols and labels.
Avoid bright, unnatural colors – the palette should feel organic.
The Custom Production Process: Step by Step
How is an ecological city planning sand table model made?
Here is the typical workflow.
Step 1: Ecological Data Compilation
You provide green infrastructure plans, habitat maps, water models, and climate adaptation strategies.
The model maker identifies key ecological systems.
Step 2: Scale Selection
Common scales: 1:1,000 to 1:5,000.
1:1,000 for detailed green infrastructure.
1:2,500 for a whole district.
Step 3: Base and Terrain
A reinforced MDF base is cut.
Natural topography is sculpted (hills, valleys, streams).
Step 4: Water Systems
Streams, wetlands, and ponds cast in blue resin.
Floodplains marked with translucent overlays.
Step 5: Green Infrastructure
Green roofs applied as flocked patches on buildings.
Bioswales and rain gardens as textured strips along roads.
Step 6: Habitat and Corridors
Wildlife corridors shown as green ribbons connecting parks.
Protected areas hatched or colored.
Step 7: Low‑Carbon Mobility
Bike routes and transit lines painted in distinct green or blue.
Step 8: Urban Agriculture
Community gardens marked with small plant symbols.
Step 9: Interactivity and Labels
Removable overlays for different climate scenarios.
Legend explaining green infrastructure types.
Step 10: Quality Control and Cover
The model is inspected for ecological clarity.
A clear acrylic cover is fitted.
A custom Ecological City Planning Sand Table Model typically takes 10 to 14 weeks.
Applications for Ecological City Models
Where are these models used?
Green Master Planning
Coordinate green infrastructure investments across departments.
Climate Adaptation Strategy
Test floodable park locations.
Identify heat island cooling corridors.
Habitat Conservation Planning
Show wildlife corridors before road projects cut them.
Low‑Impact Development (LID)
Demonstrate how bioswales and rain gardens manage stormwater.
Public Engagement and Environmental Education
Residents see how their neighborhood connects to nature.
Grant Applications for Green Infrastructure
Foundation and government funders require clear visualizations.
Integration with Other Model Types
An Industrial Park Urban Planning Scale Model might include green roofs and habitat buffers – but your ecological model covers the whole city.
Case Study: Ecological Model Guides Green City Transformation
A European city of 200,000 residents committed to becoming carbon‑neutral by 2035.
They needed to integrate green infrastructure across 20 square kilometers.
They commissioned an Ecological City Planning Sand Table Model at 1:2,500 scale, covering a 3m x 2m table.
The model showed existing grey infrastructure (grey blocks), proposed green roofs (green flocked patches), bioswales (green‑edged roads), and a new wildlife corridor (green ribbon).
Over six months, the model was used in 15 public workshops.
Residents suggested additional green connections.
The final plan increased habitat connectivity by 40% and reduced projected flood damage by 60%.
The model cost 8 million over 20 years.
Cost Factors for Ecological City Models
Area covered – 20 sq km vs. 200 sq km.
Ecological feature density – 5 features vs. 20 features.
Water system complexity – Simple streams vs. detailed wetlands and floodplains.
Interactivity – Static vs. removable climate overlays and LED water flow.
Typical range: 85,000 for a large city‑wide ecological model with multiple habitat layers and scenario overlays.
How to Choose a Model Maker for Ecological Projects
Experience with environmental or landscape models – Not just conventional urban planning.
Knowledge of green infrastructure terminology – They must know a bioswale from a rain garden.
Ability to represent water flows and habitats – Resin water and corridor ribbons.
References from environmental agencies or green developers – Call two.
Ask for a sample of a green roof detail and a wildlife corridor representation.
Maintaining and Updating Your Ecological Model
Ecological plans evolve as new green infrastructure is built.
Use magnetic or pinned green roof patches – Replace as buildings add green roofs.
Replaceable habitat corridor ribbons – Update as new connections are established.
Annual review – Compare to completed projects and updated climate data.
Budget for updates – Every 3–5 years for major plan changes.
For a Tourist City Planning Sand Table Model that includes eco‑tourism features, the same modular approach applies.
Display Tips for Maximum Impact
In a Sustainability Center
Low pedestal with natural‑spectrum lighting.
Touch screen legend with real‑time environmental data.
For Public Workshops
Place the model on a rolling cart.
Provide colored stickers so residents can propose new green features.
In a University Environmental Science Department
Use the model for teaching and research.
Common Mistakes to Avoid
Do not use bright, artificial colors for vegetation.
Green should look natural – not neon.
Do not forget water flow.
Arrows or resin ripples show how stormwater moves.
Do not isolate green features.
Show how green roofs, bioswales, and parks connect.
Do not ignore existing ecology.
The model must show what is being protected, not just new proposals.
Do not skip a legend.
Without a legend, viewers cannot distinguish a bioswale from a bike lane.
Integrating with Other Planning Model Types
An ecological city model often complements specialized models for different sectors.
A Smart City Urban Planning Architectural Model overlays sensors and data – your ecological model overlays living systems. They work together: sensors monitor green infrastructure performance.
A City Economic Zone Planning Scale Model might include an eco‑industrial park – your model shows how it fits into the broader ecological network.
For coastal cities, a Coastal City Urban Planning Sand Table Model adds sea‑level rise and shoreline habitat – your model focuses on inland green infrastructure.
An Industrial Park Urban Planning Scale Model can incorporate ecological features like habitat buffers and green roofs – at a smaller, park‑specific scale.
Each type serves a different purpose. The ecological city model is the foundation for nature‑positive urbanism.
Future Trends in Ecological City Sand Table Models
Live environmental data – LEDs change color based on air quality or soil moisture.
Augmented reality – Scan the model to see projected tree canopy growth over decades.
Modular green roof tiles – Swap different vegetation types (sedum vs. wildflowers).
Biodegradable materials – The model itself can be composted after use.
Yet the core remains.
Ecological planners need to see living systems.
A physical model does that best.
Conclusion
An Ecological City Planning Sand Table Model is essential for designing cities that work with nature, not against it.
It reveals connections, builds consensus, and guides investment.
Focus on green infrastructure, water systems, and habitat corridors.
Use natural colors and modular features.
Plan for updates as the city greens.
Whether you are an environmental planner, landscape architect, or green developer, build a model that makes nature visible.
Your city will be more resilient.
Your community will be healthier.
And remember – whether you need an Industrial Park Urban Planning Scale Model for an eco‑industrial zone, a Tourist City Planning Sand Table Model for nature‑based tourism, a Smart City Urban Planning Architectural Model for monitoring green infrastructure, a City Economic Zone Planning Scale Model for a green free trade area, or a Coastal City Urban Planning Sand Table Model for shoreline habitats, each can incorporate ecological principles. But for a holistic, city‑wide nature‑positive vision, the dedicated ecological city planning sand table model is irreplaceable.
Model nature. Build with it.


